Market Watch United Kingdom Blankets And Travelling Rugs (hs Code 6301)

Share Post
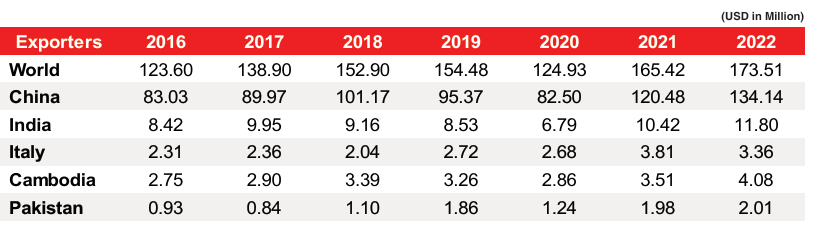
Top Exporters for Blankets and Travelling Rugs imported by United Kingdom (2016-22) (HS CODE 6301)
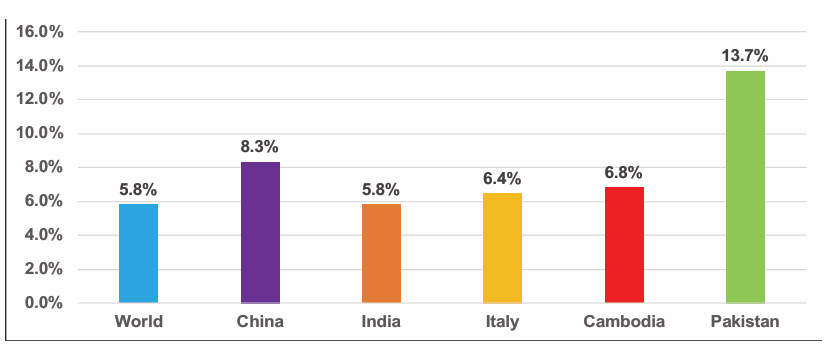
 United Kingdom Imports Growth Rate (2016-22) for Blankets and Travelling Rugs (HS CODE 6301)
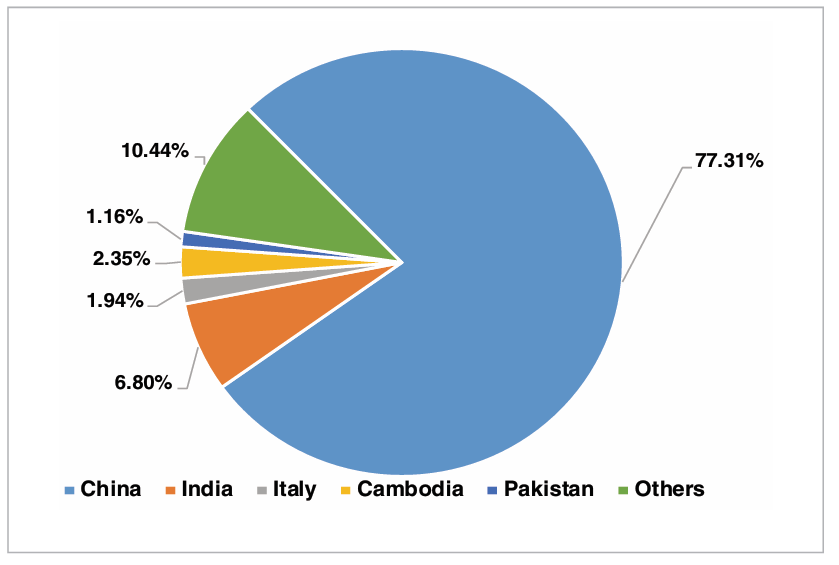
 U.K Import’s (2022) Market share for Blankets and Travelling Rugs (HS CODE 6301)
 Overview:
The UK market for blankets and travelling rugs has shown a general upward trend from 2016 to 2022, with total import values rising from $123.60 million to $173.51 million. The market experienced a dip in 2020 but recovered strongly in the subsequent years, reecting a resilient demand for these products.
China: China is the dominant exporter to the UK, with export values increasing from $83.03 million in 2016 to $134.14 million in 2022. This represents a growth rate of 8.3%. China’s exports peaked in 2021 at $120.48 million before continuing to grow in 2022, maintaining a significant lead in the market.
Italy: Italy’s exports to the UK grew from $2.31 million in 2016 to $3.36 million in 2022, representing a growth rate of 6.4%. Italy’s exports experienced fluctuations but showed an overall upward trend, contributing to the diversity of suppliers in the UK market.
India’s Position: India's exports of blankets and travelling rugs to the United Kingdom increased to $11.80 million in 2022, up from $8.42 million in 2016, indicating a positive growth trend in the market. However, India's market share remains limited, accounting for approximately 6.79% of the total U.K. imports, positioning it as a smaller player compared to the overall market dynamics. With the U.K. market experiencing consistent growth, India has signi cant potential to expand its export volume and strengthen its position as a competitive supplier.
04:41 PM, Nov 15
Other Related Topics


Foreign Buyers Forge New Ties at UP International Trade Show
04:21 PM, Sep 30
Government Extends RoDTEP Export Incentive Scheme Until March 2026
03:35 PM, Sep 30


.png)


31.PNG)
31.PNG)
51.PNG)
41.PNG)


1.PNG)

1.PNG)