Market Watch Japan Blankets And Travelling Rugs (hs Code 6301)

Share Post
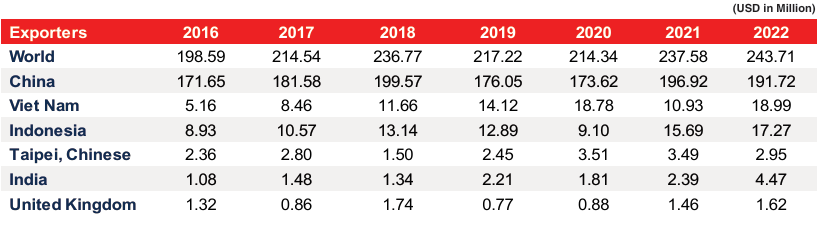
Top Exporters for Blankets and Travelling Rugs imported by Japan (2016-22) (HS CODE 6301)
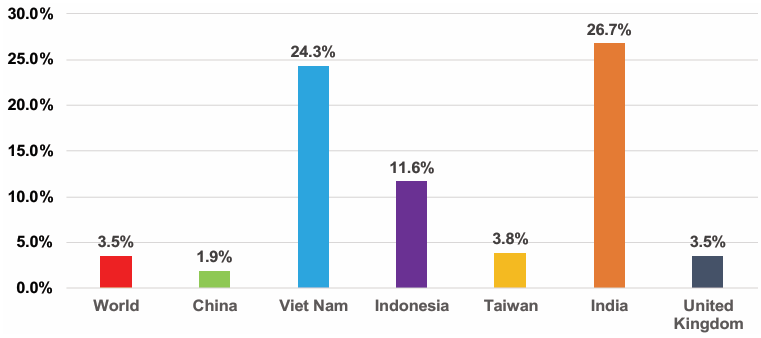
 Japan Imports Growth Rate (2016-22) for Blankets and Travelling Rugs (HS CODE 6301)
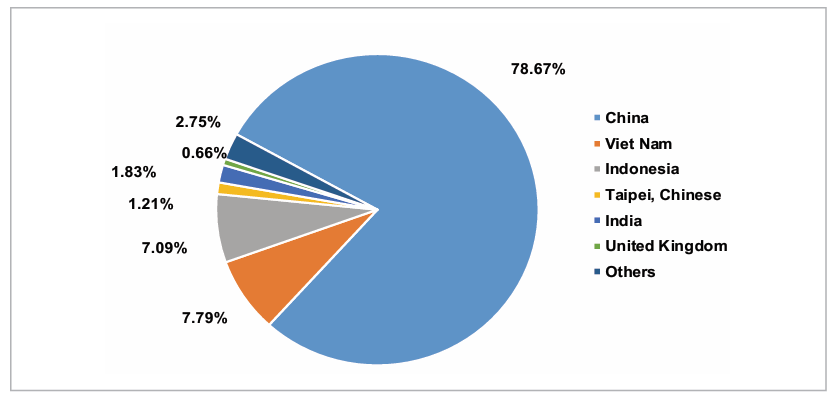
 Exporters Market Share (2022) for Blankets and Travelling Rugs imported by Japan (HS CODE 6301)
 Overview:
China: China remains the leading exporter of blankets and travelling rugs to Japan, consistently holding the largest market share. In 2022, China’s exports were valued at $191.72 million, a slight decrease from the previous year. Over the period from 2016 to 2022, China’s exports to Japan grew by 11.69%, maintaining its dominant position in the market.
Vietnam: Vietnam has shown remarkable growth in its exports to Japan, increasing from $5.16 million in 2016 to $18.99 million in 2022. This represents a significant growth rate of 268.06%. Vietnam’s rapid increase in market share highlights its expanding role and competitiveness in the Japanese market.
Indonesia: Indonesia also saw substantial growth in its exports, rising from $8.93 million in 2016 to $17.27 million in 2022. This marks a growth rate of 93.41%. Indonesia’s consistent growth indicates its strengthening presence and ability to compete in the Japanese market for these products.
India’s Position:
India's exports of blankets and travelling rugs to Japan saw a modest increase, reaching $4.47 million in 2022, compared to $1.08 million in 2016. Despite this growth, India's market share remains relatively low at approximately 1.84%, ranking it sixth among the top exporters, signi cantly behind China, which dominates with 78.65% of the market. This highlights a substantial opportunity for India to enhance its competitive stance in Japan, particularly in expanding its visibility and share in this niche market.
04:26 PM, Nov 15


1.webp)
1.webp)


.png)


31.PNG)
31.PNG)


51.PNG)
41.PNG)


1.PNG)

1.PNG)